jvisualvm: analyzing NetBeans and beyond…
As I am usually doing day-to-day work using daily builds of the NetBeans IDE, then and now I happen to run into, let’s say, peculiar situations in which figuring out what actually happens is pretty difficult. My very special friend #162706 is one of these cases – the IDE just seems busy for quite a while without obvious reasons, and you’re not really sure whether there still is something goin’ on worth waiting for it to come to an end…
After more or less loosely following Geertjans blog I rather early found out about the jvisualvm tool that comes with recent versions of Sun JDK 6, but so far I haven’t really seen any use cases for it in my environment. However, at the very least now I have figured out that this is rather good a solution for tracking down weird NetBeans behaviour by providing more reliable information, i.e. thread dumps. And there’s even more…
Dealing with NetBeans…
Indeed, my first obvious idea was trying to figure out what’s goin’ on inside a running NetBeans environment. Doing thread dumps is also possible in other ways, but at least the jvisualvm approach is pretty straightforward. On Unix systems, jvisualvm is found in the same place your java binary lives, so if you’re capable of running java -version from within a terminal, you’ll also be capable of running jvisualvm from there.
[kr@n428 7:56:18] ~> java -version

java version "1.6.0_13"

Java(TM) SE Runtime Environment (build 1.6.0_13-b03)

Java HotSpot(TM) Server VM (build 11.3-b02, mixed mode)

[kr@n428 7:56:23] ~> which jvisualvm

/home/kr/kontext/runtime/linux/java/bin/jvisualvm

[kr@n428 7:56:26] ~> which java

/home/kr/kontext/runtime/linux/java/bin/java
Once you started the application simply using the jvisualvm command, you’ll end up with a main application screen like this:
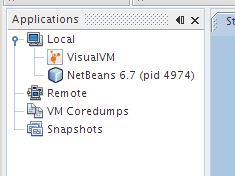
If you are a NetBeans user, the user interface pretty quickly will look familiar to you as jvisualvm basically “just” is an application based upon NetBeans RCP. Asides this, you will see an “Applications” window. In my case, the NetBeans I want to debug being already running, I can see the NetBeans process (pid 4974, in this example) below the “Local” node, so by now I am ready to get going:
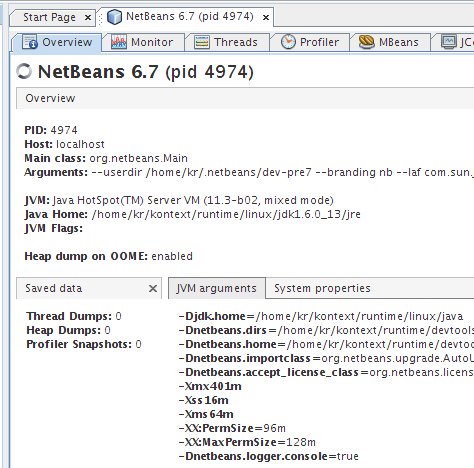
Double-clicking the “NetBeans 6.7” icon in “Local” will make jvisualvm connect to this process which might take some time but in the end provide me with a brief diagnostics overview showing basic information about the NetBeans process and its environment:
Right now, you have quite an amount of helpful tools at hand trying to figure out where your problem is, like doing CPU or memory profiling (analogous to the feature set already offered in NetBeans for developing Java applications), analyzing memory consumption and garbage collection, and, as desired in my situation, looking at threads and doing a thread dump. For that, the “Threads” window is what you want:
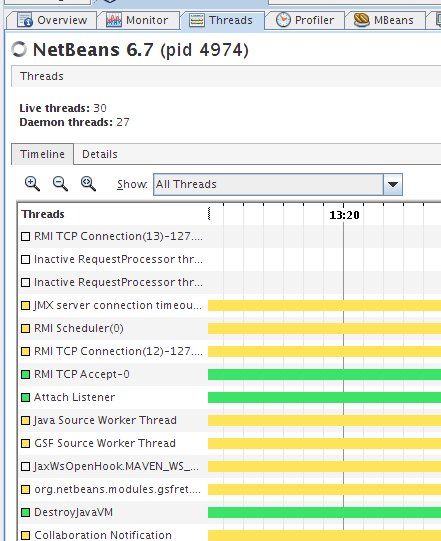
By now, there’s a button labeled “Thread dump” (the same can be achieved by right-clicking the application in the “Applications” window and choosing “Thread dump” from the context menu). Doing so will result in, obviously, jvisualvm generating a thread dump for the running application. As soon as this is finished, it both will appear opened in a new editor on the right side of the window and, as a child node below the application (NetBeans, in my case) in the “Applications” window:
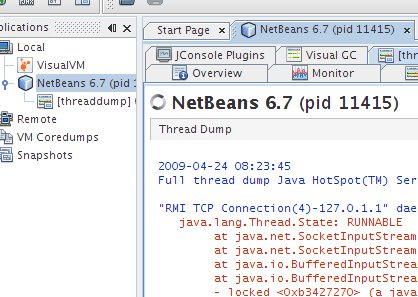
By now, you can merrily browse through the dump and see what might be flaky in your current situation. Another good option, if required: In case you are about to file an issue against NetBeans regarding this behaviour and/or want to attach yourself to an existing issue, you might want to add this thread dump simply to provide developers with additional information to track down the problem. To do so, right-click the “[threaddump]…” node in the “Applications” window, choose “Save as…” and enter an appropriate name. This will result in generating a plain text file ending in “.tdump” containing the full thread dump as displayed in the jvisualvm window. This file, by then, might be attached to an issue filed against any application you’re likely to debug, or it might be sent to your application developer helping them getting your tool improved. The same procedure can be used i.e. for generating heap dumps or application snapshots, which all in itself is rather valuable while knee-deep into debugging work.
…and beyond.
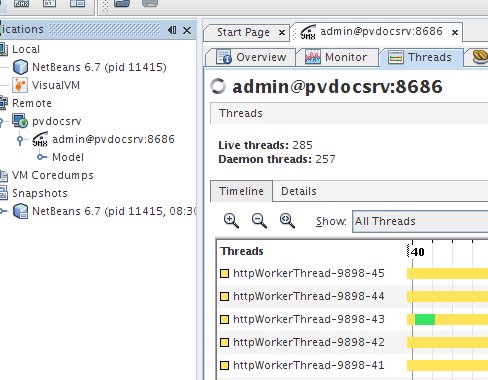
So far, we’ve been looking at a Java application running on the same host jvisualvm runs on. While this is fine for desktop and overall development debugging, in a real-world environment your applications might run on some sort of application server, Glassfish in our case. Fortunately, jvisualvm also allows for working with remote applications i.e. making use of JMX. Masoud Kalali has written a quick guide on how to set up jvisualvm to work with Glassfish and, after goin’ through this procedure, indeed I am capable of doing more or less the same I previously did dealing with a local application now interacting with my remote production Glassfish:
So, overall conclusions and hints:
- If you ever filed an issue against NetBeans, eventually were asked to attach a thread or heap dump and have absolutely no clue how to do so, jvisualvm is a very helpful friend helping you getting this done.
- I like the chance of doing application debugging, but the capabilities in dealing with remote servers surely will make jvisualvm a tool I do not want to miss in my everyday tool box.
